What is ZenTables?
Data scientists often need to report descriptive statistics presented in neatly formatted tables, which is a process surprisingly not well-supported by either Python or R. In Python in particular, while pandas provides basic functionalities such as pivot tables, it is not easy to create frequency tables with percentages and/or subtotals or mean tables with standard deviations. Afterwards, it still takes hours to integrate these tables into a report or paper and format them in Google Docs or Microsoft Word. To further complicate things, if any result changes while drafting the report, the entire process needs to be repeated over and over again.
ZenTables (GitHub) is a Python package designed to relieve some of these headaches. With ZenTables, you can easily format any pandas DataFrame with one line of code and turn them into a visually appealing, easily publishable table. You can also effortlessly create popular descriptive tables on-the-fly. Most importantly, you can transfer these tables into Google Docs and any other word processors with just one click.
Installation
Installing ZenTables is very easy. First, ensure that you have Python 3.7.1+ and pandas 1.3.0+ installed. Then, you can install ZenTables with pip:
pip install zentables
How to use ZenTables?
To use ZenTables, import both pandas and ZenTables in your Jupyter Notebook:
import pandas as pd
import zentables as zen
Then you will be able to access all ZenTables functionalities as a pandas add-on. To illustrate this, let’s first import some data:
url = (
    "https://raw.githubusercontent.com/thepolicylab"
    "/ZenTables/main/tests/fixtures/superstore.csv?raw=true"
)
super_store = pd.read_csv(url)
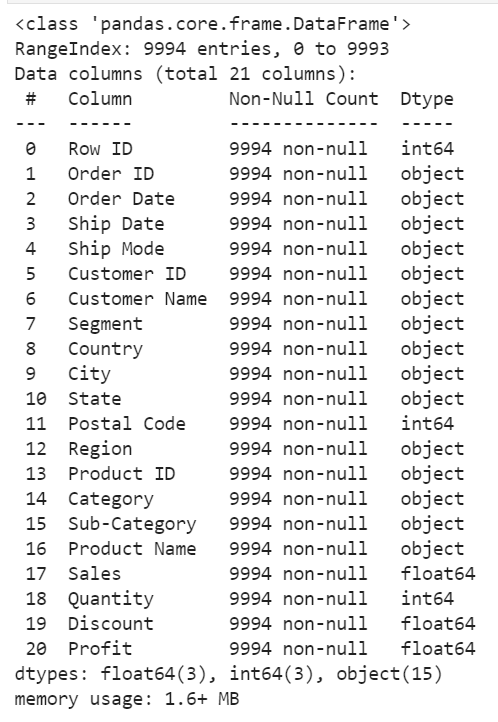
This is a sales spreadsheet of a fictional super store that sells various merchandise. (Thanks to the Tableau team for sharing this example data set!). Each row of the data set is an order that has an order ID, order date, shipping date, customer ID, sales, and other related information.
First, let’s create a pandas DataFrame that counts the number of orders by different categories with the pivot_table function in pandas:
df = super_store.pivot_table(
    index=["Segment", "Region"],
    columns=["Category"],
    values="Order ID",
    aggfunc="count",
    margins=True,
)
df
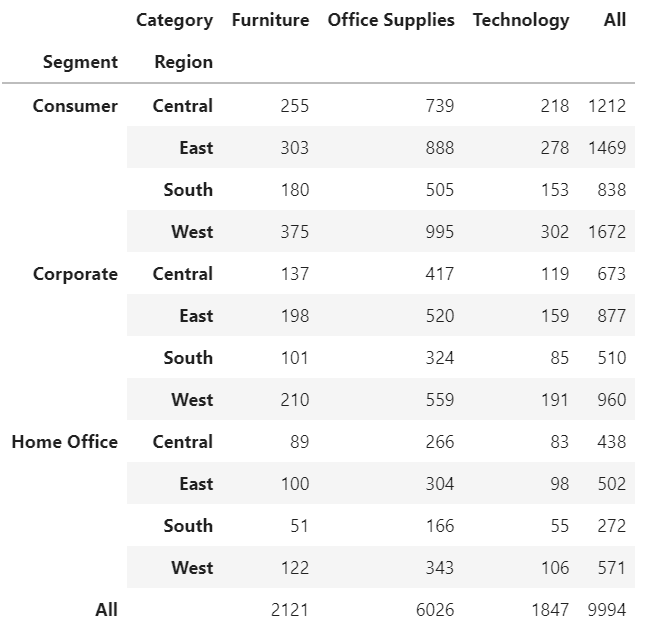
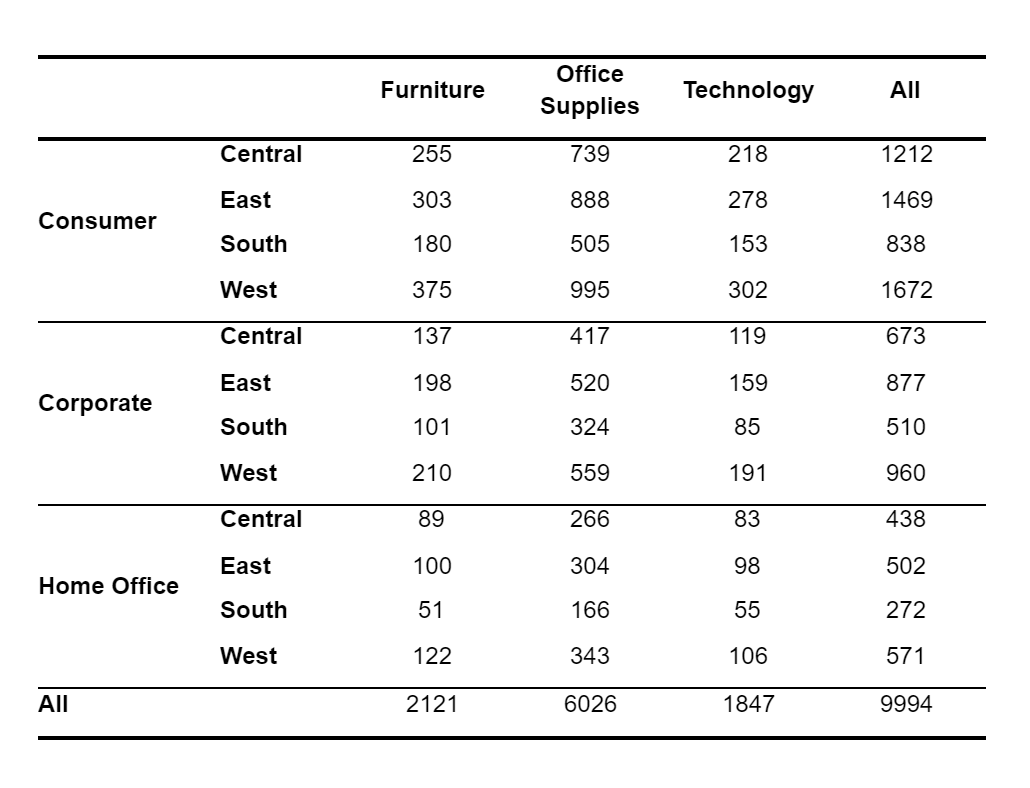
This creates a DataFrame that reports the numbers (counts) of orders by segment and region on the rows and by merchandise category on the columns. The margins argument of the pivot_table() function provides the totals on the rows and columns.
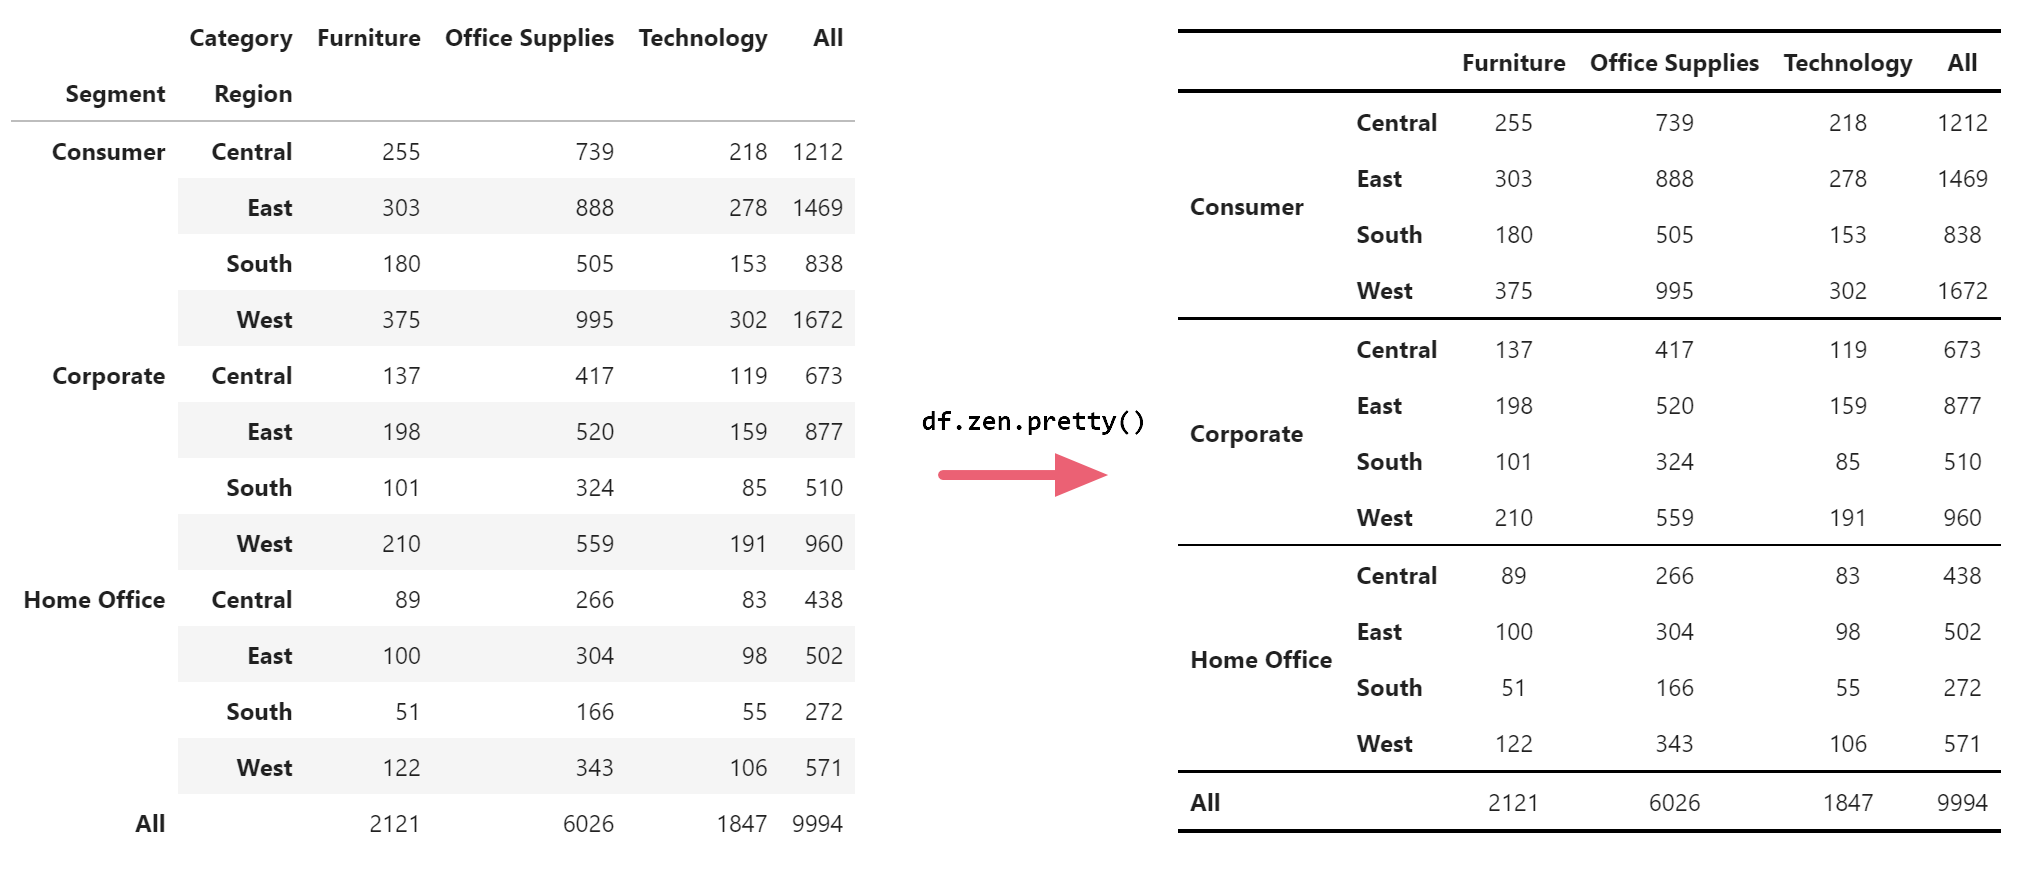
Now let’s see what ZenTables can do to make this table look better:
df.zen.pretty()
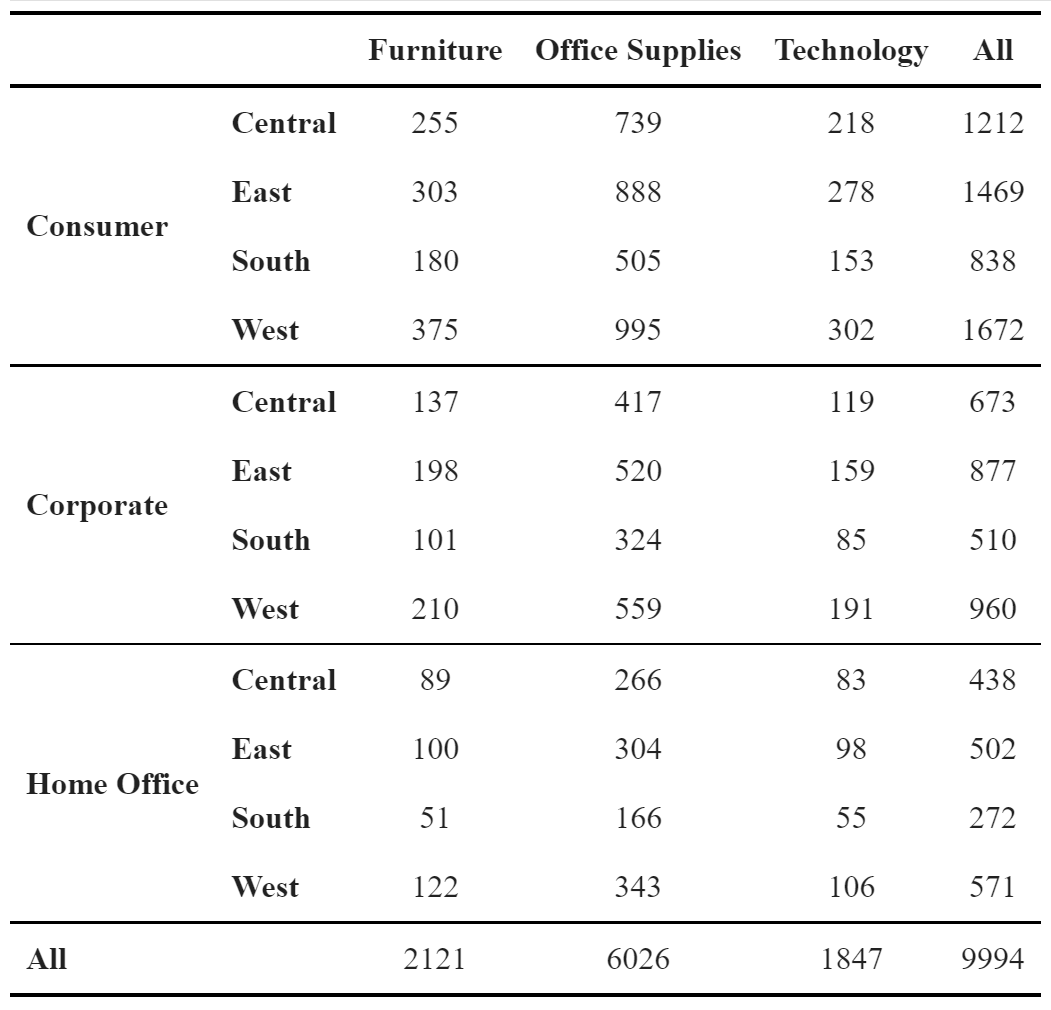
That’s it! ZenTables works on any DataFrame object. Just use the accessor .zen with any DataFrame and all functionalities are readily available. Here’s the table that ZenTables outputs.
Note the improvement in readability compared to the original output, and you only need to write one line of code. You can even chain the method with the original code like this:
super_store.pivot_table(
    index=["Segment", "Region"],
    columns=["Category"],
    values="Order ID",
    aggfunc="count",
    margins=True,
).zen.pretty()
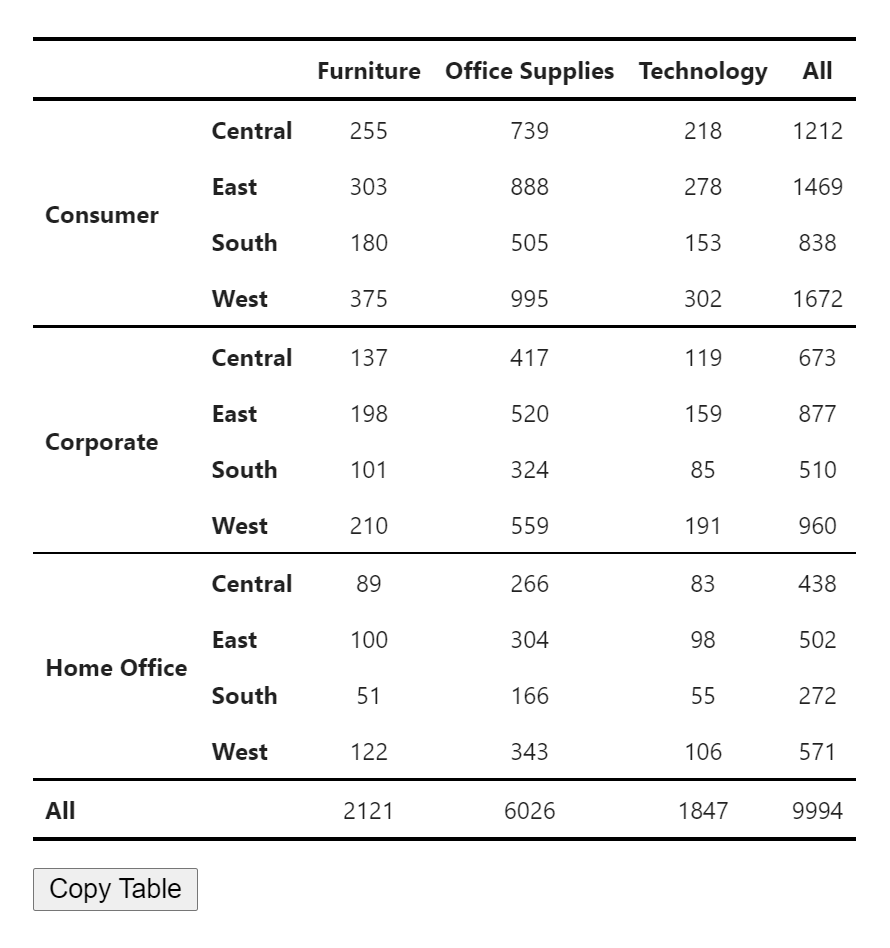
Now you can also click the “Copy Table” button. The table will be copied to your clipboard and ready to be pasted into Google Docs. Below is the result. Note how all formatting was preserved.
You can also control the fonts and font sizes of the output. We are working on adding more customization options to ZenTables.
df.zen.pretty(font_family=”Times New Roman”, font_size=12)
Use ZenTables to create common descriptive tables
Another feature of ZenTables is that it makes it easy to create descriptive tables commonly found in publications, such as frequency tables and mean tables with standard deviations. These tables typically require special treatments such as providing percentages or standard deviations in parentheses or adding subtotals and totals. ZenTables handles all these things for you.
1. Frequency Tables with df.zen.freq_table()
First, let’s see how to create frequency tables using df.zen.freq_table()
freq_table = super_store.zen.freq_table(
    index=["Segment", "Region"],
    columns=["Category"],
    values="Order ID",
    props="columns",
    totals=True,
    subtotals=True,
    digits=1,
)
freq_table.zen.pretty()
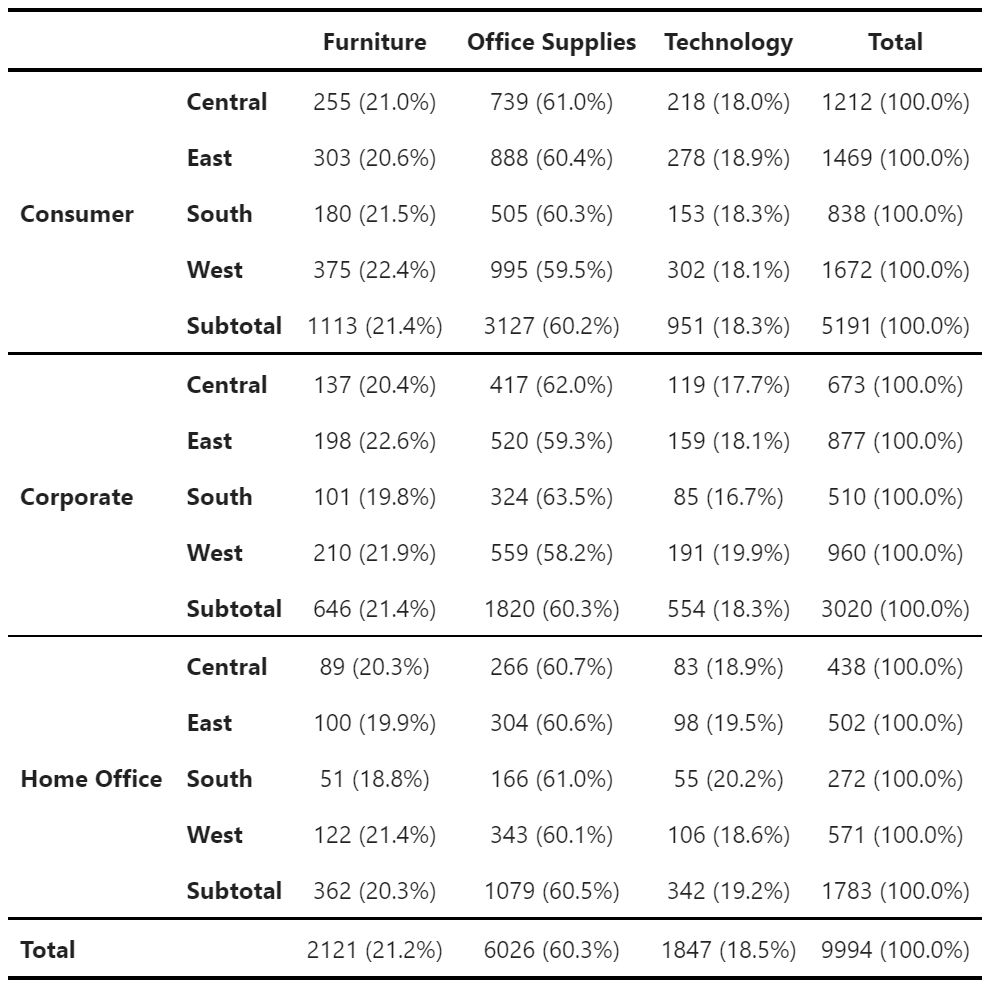
Note how similar the freq_table() api is to the pivot_table() api. You specify the grouping on the index and columns and the column name(s) of values that you want to count, which is exactly the same as pivot_table(). Then, you specify whether you want percentages to be calculated as well, and if so, by “index”, “columns”, or “all”, which calculates percentages of the grand total of the sub-category. In this example, it is set to “index”, which percentages are calculated on the rows. Use “totals” and “subtotals” to control whether you want totals and subtotals to be calculated and “totalsname” and “subtotalsname” to control what is displayed on the total and subtotal rows/columns. In addition, you can use “digits” to control how many digits after the decimal point are included before the percentage sign.
2. Mean tables with standard deviations with df.zen.meansdtable()
Another common descriptive table is mean tables with frequency and standard deviation. The df.zen.mean_sd_table() is designed specifically for this:
    mean_sd_table = super_store.zen.mean_sd_table(
    index=["Segment", "Region"],
    columns=["Category"],
    values="Sales",
    margins=True,
    margins_name="All",
    submargins=True,
    submargins_name="All Regions",
    digits=1,
)
mean_sd_table.zen.pretty()
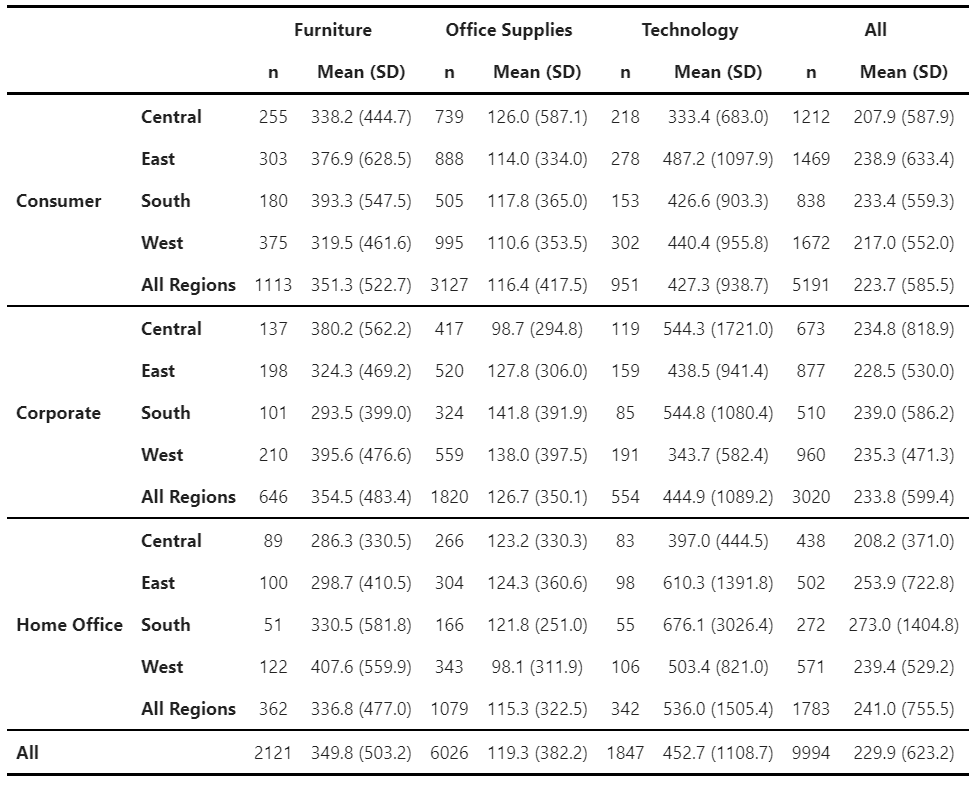
Again, this function provides a similar API to freq_table(). The only difference is that, instead of specifying totals and subtotals which only makes sense for frequency tables, we specify margins and submargins. Note that we can also use margins_name and submargins_name to control the names of the margin/submargin row/columns.
3. A more general df.zen.pivot_table()
You might wonder: what if I have other types of tables that I would like to create? No problem! ZenTables also has a generic pivot_table() function that is built on the pandas version of pivot_table(). For example, if you want to create a table with counts, mean, and median, you can do this:
mean_median_table = super_store.zen.pivot_table(
    index=["Segment", "Region"],
    columns=["Category"],
    values="Sales",
    aggfunc=["count", "mean", "median"],
    margins=True,
    margins_name="All",
    submargins=True,
    submargins_name="All Regions",
).rename(
    columns={
        "count": "n",
        "mean": "Mean",
        "median": "Median",
    }
)
mean_median_table.zen.pretty().format(precision=1)
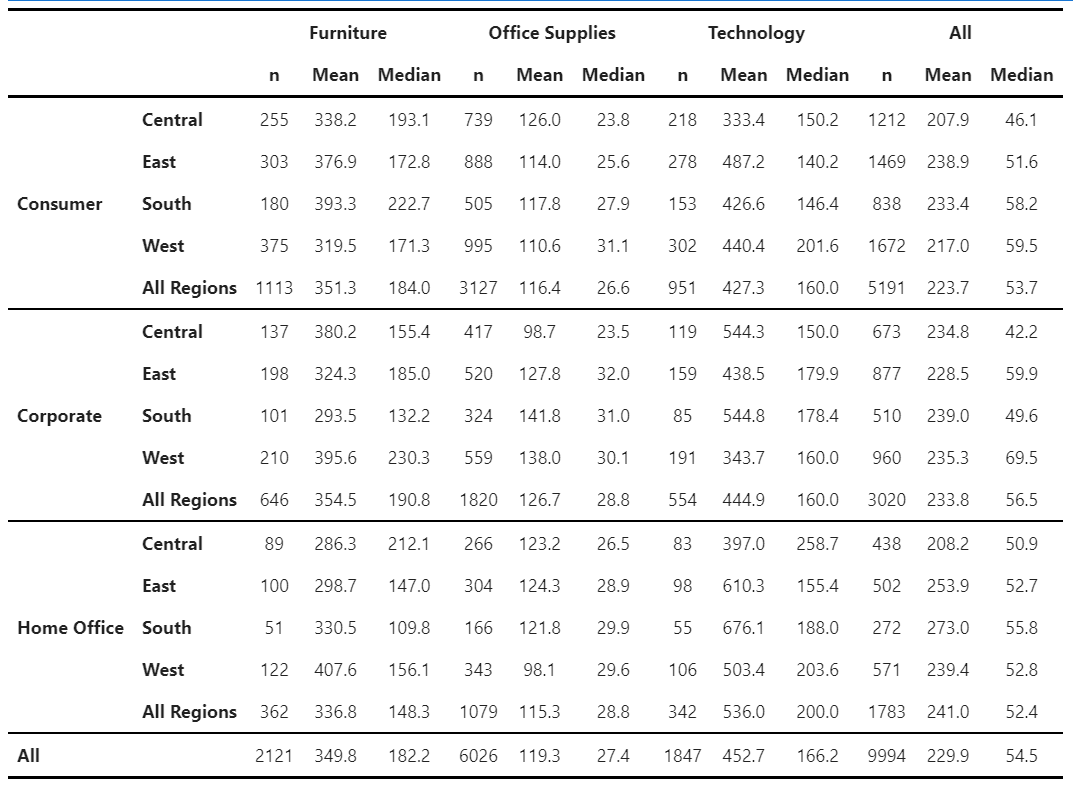
There are two differences between the ZenTables pivot_table() and pandas pivot_table(). First, the columns are grouped by values, columns, and then aggfunc instead of by aggfunc, values, and columns. The former order is preferable in a table for reporting because the resulting table is much more readable. Second, the ZenTable pivot_table() also provides submargins and submargins_name for creating submargins, a functionality that the pandas pivot_table() currently does not have.
Pro Tips: All ZenTables functions return pandas objects that you can manipulate further. The df.zen.pretty() function returns a subclass of the recently renovated Styler object which allows you to modify the look of the table further, such as highlighting certain values and creating bar charts. See the Table Visualization section in the pandas documentation for more information. In the previous example, we used the format method to set the number of digits for floating values displayed to 1. All df.zen.*_table() functions return pandas DataFrames which you can manipulate further.
Maintain consistent table aesthetics with global options
When making tables for publications, you might want all of your tables to look consistent, but when you have a lot of tables, it may be too much work to change the aesthetics of each of them. Like pandas, ZenTables provides global options for you to customize the look of your tables at the notebook level. You can change the font and font size of all of your tables by doing this right after importing zentables:
zen.set_options(font_family="Times New Roman, serif", font_size=12)
Now all of your tables will use “Times New Roman” at 12 points as default fonts. This global option is overridden when you specify font_family and font_size within the df.zen.pretty() method.
Future work and concluding comments
With ZenTables, our hope is to simplify your workflow involving table reporting and double or even triple your productivity. We will continue to work on it to make it better. We are planning to work in the following directions:
- Adding more common table types
- Support for statistical tables
- More customizability
- A theming system
- Compatibility with major citation formats
- And many more!
Please feel free to reach out on our GitHub and let us know your thoughts and comments on ZenTables! Collaboration and PRs welcome!
How to cite this Reflection: Xu P. (2021, August 25). ZenTables: Stress-free table publishing in Google Docs with Python. The Policy Lab. https://thepolicylab.brown.edu/reflections/zentables-stress-free-table-publishing-in-google-docs-with-python


