How can districts improve equity through school choice policies?
Project Summary
For school year (SY) 2020-21, Providence Public School District (PPSD) altered their method for placing incoming kindergarten students at elementary schools. The aim was to reduce time spent on buses and, by extension, potential exposure to the COVID-19 virus. As with any policy change, however, there can be unintended consequences. In this project, we looked at how kindergarten school access and enrollment patterns altered under this policy (i.e. between SY 2019-20 and SY 2020-21) so that PPSD can better balance COVID-19 precautions and equity concerns across demographic groups moving forward.
Why is this issue important?
For school year (SY) 2020-21, Providence Public School District (PPSD) altered their method for placing incoming kindergarten students at elementary schools. The aim was to reduce time spent on buses and, by extension, potential exposure to the COVID-19 virus.
Kindergarten students at PPSD have historically been able to request assignments to schools regardless of proximity to their home. The registration deadline for school choice is typically in the spring prior to the upcoming school year. Under this model, students select up to four schools and are placed in the order of their school choice to the extent that is allowed by school capacity. If demand for a school exceeds capacity, students are generally assigned these seats by lottery. Students who are not assigned one of their four chosen schools or who miss the spring school choice registration deadline are assigned to the closest school with an available seat and a suitable educational program.
For SY 2020-21, however, PPSD announced that rather than prioritizing families’ school selections over school proximity, they would instead use an algorithm to assign students to the closest school with available seats for the student’s educational type (e.g. multilingual learner, general education, etc.).1 The order in which students were assigned was randomized. If, after all students were assigned schools, there were still open seats in a school2, students might be reassigned based on their initial school choice3. By assigning students to schools within one mile of their homes, PPSD hoped that commute times would be shortened and that fewer students would need bus transportation, thus lowering the risk of exposure to the coronavirus.
As with any policy change, however, there can be unintended consequences. PPSD was concerned that, given historical racial and socio-economic segregation patterns, emphasizing proximity and reducing school choice options might create more segregated schools or unintentionally put certain subpopulations of students at a disadvantage. In this project, we looked at how kindergarten school access and enrollment patterns altered under this policy (i.e. between SY 2019-20 and SY 2020-21) so that PPSD can better balance COVID-19 precautions and equity concerns across demographic groups moving forward.
What did we do?
In close partnership with PPSD, we first explored whether the policy was successful on its own terms. Did more students in fact attend schools within one mile of their homes? Next, we developed three key metrics to help determine whether prioritizing students’ proximity to their schools created or worsened disparities in: (a) kindergarten students’ choice to enroll in PPSD; (b) the quality of schools4 in which kindergarten students were enrolled; and (c) kindergarten student attendance.
To explore these metrics, PPSD’s Office of Research, Planning, and Analysis (RPA) provided us with extensive data, such as historical student demographics, school demographics, and students’ school preferences. We combined these data with publicly available sources such as data from the Census Bureau’s American Community Survey and looked at how trends differed between SY 2020-21 and previous school years.
What did we learn?
Did the policy change have the intended effect?
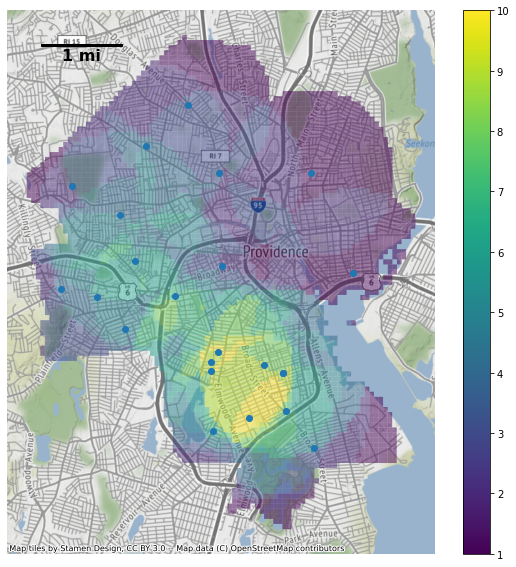
Yes, we found that 74% of kindergarten students attended a school within one mile of their home address in SY 2020-21 compared to 62% the year before. We did not observe disparities by geographic regions. Map 1 shows the areas with the largest increases in the proportion of kindergarten students who attended a nearby school.

Were there disparities in school quality?
Our findings suggest that the revised policy generally did not disadvantage under-resourced students. First, we determined that most students had access to higher performing schools, with almost all kindergartners living within one mile of a Star 2 or 3 school. Next, we checked to see if certain student populations were disproportionately attending Star 1 schools despite having access to higher performing schools. Here, we observed minimal discrepancy between the median Star ratings of schools students could access and the schools in which they were placed. We found no demographic bias when students (22%) were placed in a Star 1 school (which likely occurred when seats at better performing schools were filled).
Were there disparities in student attendance across student demographics?
Unfortunately, because this policy change took effect during the COVID-19 pandemic (which itself led to declining attendance), we were unable to tease out the degree to which changes in attendance were affected by the policy change versus the pandemic. On the whole, absenteeism rates increased across PPSD. We observed that increases in absenteeism rates were highest for students who resided in neighborhoods with ‘High’ and ‘Very High’ rates of poverty5 (a three to five-fold increase, regardless of racial group), and Hispanic and multiracial students who resided in neighborhoods with ‘Medium’ rates of poverty. This could be due to noise, but it bears looking into further. We also observed that Black and White students in ‘Medium’ poverty neighborhoods saw a decrease in the proportion of students with high absenteeism levels. Overall, the percent of students with excessive absences6 from September to December 2020 jumped from 8.3% to 26.5% between SY 2019-20 and SY 2020-21, with the percent of students who missed more than half of all school days increasing eightfold (from 0.8% to 6.3%).
Were there increased disparities in kindergarten enrollment?
As with student attendance, we were unable to determine the impact of the policy change versus the pandemic on enrollment. However, we did find that the sharp decrease in enrollment, whatever the cause, was not evenly spread across the district or across student demographic groups. COVID-19 radically disrupted enrollment, which fell by 21% overall. Enrollment dropped the most in schools near the edges of Providence’s city limit (approximately 30% compared to 12%) and that had lower Star ratings7 (roughly seven times higher). Decreases in enrollment were also unevenly distributed among student populations, with Hispanic students (25.2%↓), girls (23.5%↓), and special education students (23.0%↓) experiencing steeper drops in enrollment than the overall population (20.6%↓). On the other hand, EL enrollment (18.3%↓) decreased less than the overall population. We note that given the overall interruption in enrollment in PPSD during the pandemic---a circumstance which has affected schools nationwide---we cannot know whether this disparity is connected to PPSD’s choice policy. Nevertheless, these numbers provide important context to what is happening in this unprecedented time.
What happens next?
These analyses confirmed that the new assignment algorithm reduced the number of miles traveled by students, without accidentally worsening any disparities. PPSD plans to continue using the algorithm for SY 2021-22.
What happened behind the scenes?
This project would not have been possible without close collaboration from the Office of the Deputy Superintendent for Operations (DSO) to guide which analyses would be most impactful to the district, as well as from the Office of Research, Planning and Accountability (RPA) who provided historical data as well as their deep knowledge of how that data was created.
This project evolved mostly in weekly meetings between key stakeholders, including DSO, RPA, and the school assignment team. We thank them for their partnership in this work.
-
Exceptions were made for students in specialized programs (e.g. special education programs) to ensure they received the appropriate services. Siblings continued to receive preference to be placed in the same school as their sibling. Seats at limited enrollment programs (e.g. Dual Language programs) were assigned by lottery.
↩ -
The pandemic took a heavy toll on overall enrollment: PPSD saw a 20.6% decrease in kindergarten enrollment in SY 2020-2021 compared to the previous year. As such, not all schools had filled seats.
↩ -
Because of the timing of the COVID-19 pandemic, the SY 2020-21 school choice window was underway when PPSD decided to adjust its policy. PPSD still retained the school selections for these students.
↩ -
We used Rhode Island’s Star Ratings system to define school quality. See:
↩ -
We determined the poverty rate for each census block group (CBG) by dividing the CBGs into quartiles based on the percentage of households within the CBG that earned below the poverty threshold as determined by the American Community Survey for 2019. CBGs were then assigned ‘Low’, ‘Medium’, ‘High’, and ‘Very High’ poverty rates according to the quartile they fell under.
↩ -
Excessive absence is defined as missing between 20% and 50% of all school days.
↩ -
The Star rating system is on a five-point scale, with one being the lowest rating. All elementary schools in Providence had a 1, 2, or 3 Star rating; no elementary schools had 4 or 5 rating.
↩
How to cite this Project: The Policy Lab. (2021, September 27). How can districts improve equity through school choice policies?. The Policy Lab. https://thepolicylab.brown.edu/projects/how-can-districts-improve-equity-through-school-choice-policies


