How much does a letter campaign increase willingness to get a COVID-19 test?
Project Summary
To manage the pandemic, health officials need data from widespread and regular COVID-19 testing. In May 2020, the Rhode Island Department of Health (RIDOH) needed to estimate how many people in Rhode Island had been exposed to the virus, in order to inform decisions about how to allocate resources and what safety regulations to put in place. They needed to ask people to get tested. What is the best way to ask? This project evaluated the effectiveness of using different designs of mailed letters to encourage COVID-19 testing.
Why is this issue important?
To manage the pandemic, health officials need data from widespread and regular COVID-19 testing. How many of which type of people have or had the disease? Answering that question relies on people being willing and able to get a COVID-19 test when requested. This is particularly important when trying to measure how many people in an entire state have been exposed to the disease. Practically speaking you can’t test everyone in the state at once; you instead ask a random sample of people to volunteer to be tested, and then use their results to estimate what would be found if everyone were tested.
In May 2020, the Rhode Island Department of Health (RIDOH) needed to estimate how many people in Rhode Island had been exposed to the virus, in order to inform decisions about how to allocate resources and what safety regulations to put in place. They needed to ask people to get tested. What is the best way to ask?
What did we do?
This project evaluated the effectiveness of using letters to encourage COVID-19 testing. In particular, between May 7th and 13th 2020, letters were mailed to 5,000 randomly selected households. Each household was randomly assigned to receive one of two differently designed letters.
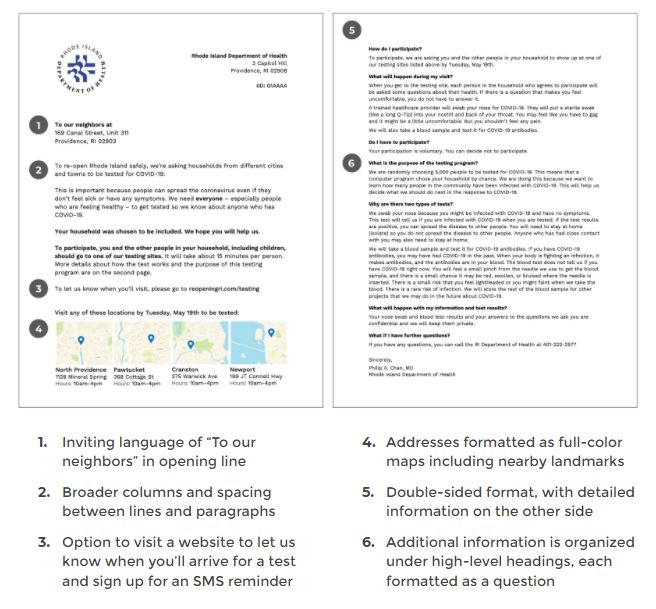
Letter A was the default version, with a design familiar to anyone who has received a standard government mailer. It was carefully worded for accuracy and comprehensiveness. There were details such as the rationale for the request, where a person can be tested, and the fact that participation was voluntary. But the end result was rather dense, with front-and-back pages filled with black-and-white text.
Letter B included all of the same content of Letter A, but it was redesigned using principles from behavioral science and user-centered design. For example, Letter B is simpler in layout and it includes maps, a suggested deadline, and an optional sign-up to receive an SMS reminder (see Figure 1).
Since the two letters were randomly assigned to households, they allowed us to estimate relative letter effectiveness by way of a randomized controlled trial (RCT) or “A/B test.”
What have we learned (so far)?
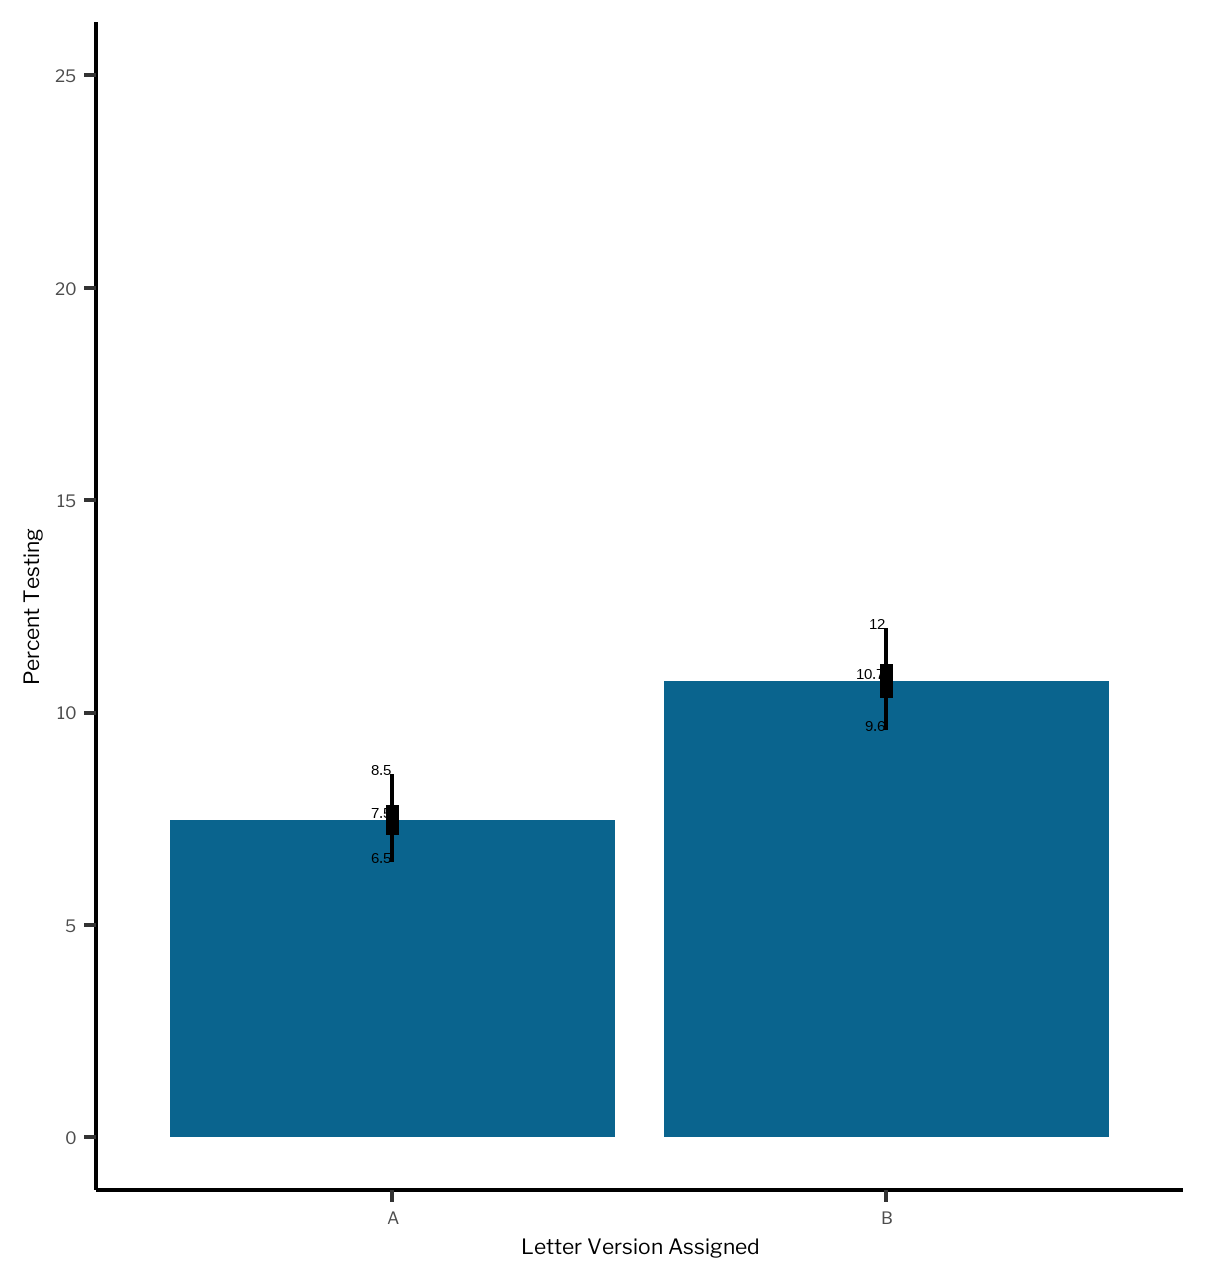
The letter redesigned based on behavioral science principles (Letter B) meaningfully increased show-ups for COVID-19 testing: 10.7% of Letter B recipients showed for testing, compared to only 7.5% of those receiving Letter A.
Statistically we estimate a 3.3 percentage point effect size, with a 95% confidence interval spanning from 2 to 5 percentage points—or in relative terms, anywhere from a 25% to 60% boost in performance. Noting that the letters cost the same to mail, this result highlights how quickly a little extra effort on design can generate a substantial return.
What happens next?
Future rounds of letters are using the design principles from Letter B as the starting default. No more heavy, text-only communications. And more generally, this project demonstrated how the design approach of using behavioral science, coupled with A/B testing, can be used to quickly and cheaply improve communications. We recommend that public health campaigns embed this approach as a best practice throughout their day-to-day work. To that end, we’re running additional A/B tests with RIDOH—so stay tuned for more results.
If you're interested in thinking about how to redesign public communications with behavioral science in mind, email us at thepolicylab@brown.edu.
What happened behind the scenes?
A challenge was figuring out how to contact conceivably any Rhode Islander. No jurisdiction in the United States maintains a database of all its residents with reliable, up-to-date contact information. There are records providing some of that information, but none with all of it. The state has a registry of driver’s license holders, for example, but of course not everyone has a driver’s license. We created a workaround to this problem, and—stay tuned—we’re going to soon release a Reflection to share that story.
How to cite this Project: The Policy Lab. (2021, February 26). How much does a letter campaign increase willingness to get a COVID-19 test?. The Policy Lab. https://thepolicylab.brown.edu/projects/covid-seroprevalence-letter-experiment


